
01
Mission
Empowering leaders with data-driven clarity.
We help organizations turn complex systems into practical decisions using analytics, simulation, AI, and operational engineering.
Who We Are
An agile team of highly qualified experts with 50+ years of combined experience at the intersection of AI, operational engineering, and growth strategy. We bridge the gap between complex technology and boardroom execution.
What guides every build
We help organizations turn complex systems into practical decisions using analytics, simulation, AI, and operational engineering.
We design, test, and deliver decision systems that make operations smarter, clearer, and easier to scale.
What We Do
Every engagement combines these four disciplines to turn operational complexity into measurable performance gains.
Served Industries
We bring data analytics, simulation, and proven methodologies to the industries where complexity creates the most value.




Solutions
Map the process and find bottlenecks.
Virtual system replication for scenario testing before implementation.
Optimize staffing and resource allocation to match demand patterns.
Reduce wait times and redesign flow paths using cycle-time diagnostics.
KPI dashboards for utilization, throughput, and performance control.
Forecasting models for demand, arrivals, and lead-time variability.
Classification and prediction models integrated with operating policies.
Compare scenarios side-by-side with clear cost, risk, and upside projections.
Coverage optimization with travel, demand, and capacity constraints.
Process mapping tied to wait time, conversion, and service variability.
Store execution analytics linked to compliance and performance.
Computer-vision checks for shelf conformance and replenishment.
Intelligent routing that reduces fleet size while meeting delivery windows.
Delivery network optimization balancing speed, reliability, and cost.
Network models minimizing total transport and service cost.
Route-cycle diagnostics for utilization, turnaround control, and cost per mile.
Forecast demand to optimize replenishment timing and capacity planning.
Right-size stock levels to meet service targets while minimizing costs.
Distribution-network modeling under lead-time and resilience constraints.
Scenario planning for disruption risk, recovery, and service protection.
Case Studies
Six recent engagements across the industries we serve.
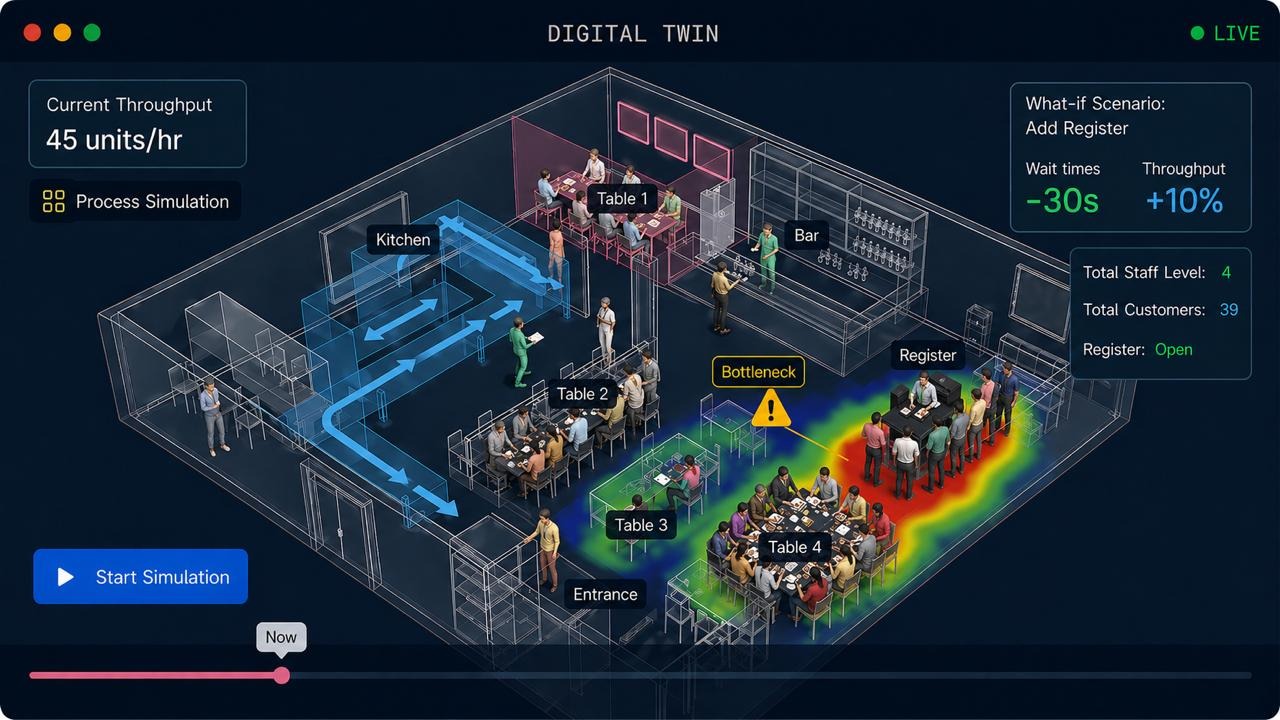
A digital twin of clinic operations that anticipated bottlenecks before a major location move and optimized staffing on day one.
Read Case Study →Process maps, DCF, and Monte Carlo simulation to validate the right order fulfilment strategy under uncertainty.
Read Case Study →Quadratic programming that scaled a single flagship segmentation study across 100+ stores at minimal cost.
Read Case Study →A vehicle routing algorithm that reduced fleet size and operating costs while maintaining full service coverage.
Read Case Study →An AI engine that prices every stay date using events, demand, supply, and historical performance for maximum revenue.
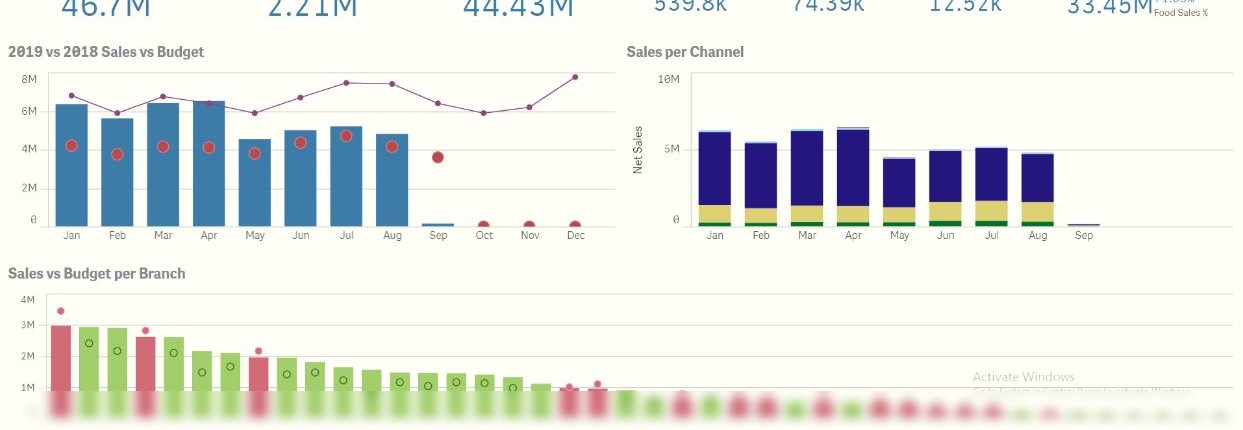
Read Case Study →Two BI dashboards consolidating sales, financial, and operational data into a single source of truth across every branch and channel.
Read Case Study →Contact Us
Get in touch by email. We respond within one business day.
Case Study
How a major regional restaurant chain replaced gut feel and delayed reports with real time, data driven decision making across every branch, channel, and menu item.
01 / The Challenge
A leading regional restaurant chain operates dozens of branches across multiple channels, generating massive volumes of transactional and financial data every single day. Despite having all of this information at their fingertips, leadership was unable to turn it into timely, confident decisions.
Data lived in disconnected systems. Sales, financials, discounts, and operational feeds each told a fragmented story. Managers relied on self reported numbers. Variance analysis took days of spreadsheet work. By the time insight reached the executive team, the window to act on it had already closed, leaving every decision to be made on instinct rather than evidence.
02 / The Approach
orcaid consolidated every disconnected data source into two purpose built BI dashboards, one for Sales and one for Financial performance. The dashboards unify POS, financial, budget, and operational feeds into a single source of truth, putting real time, decision ready intelligence in leadership’s hands, from the executive P&L all the way down to individual transactions.
 Executive Overview
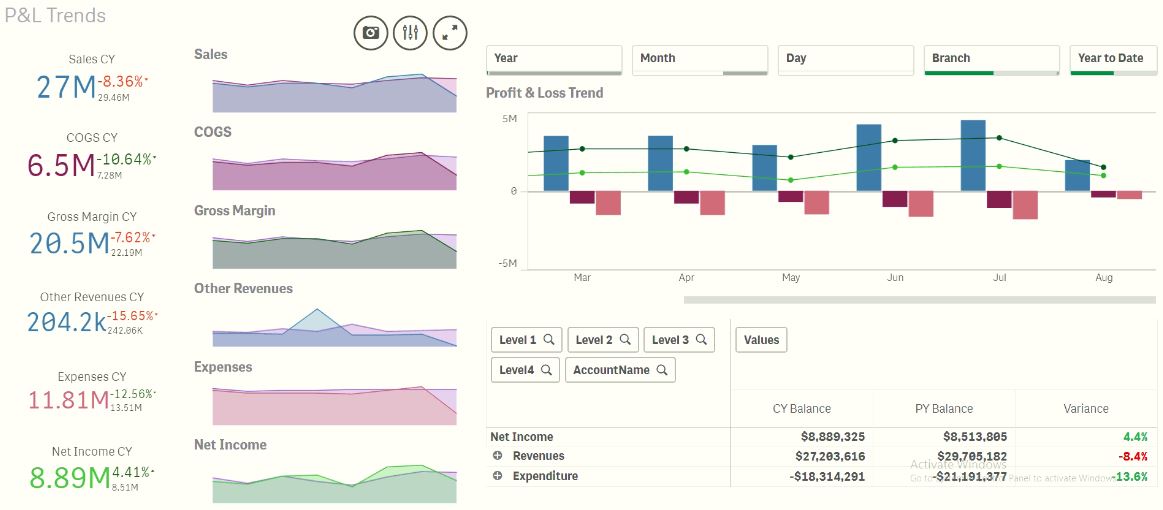 P&L Trends
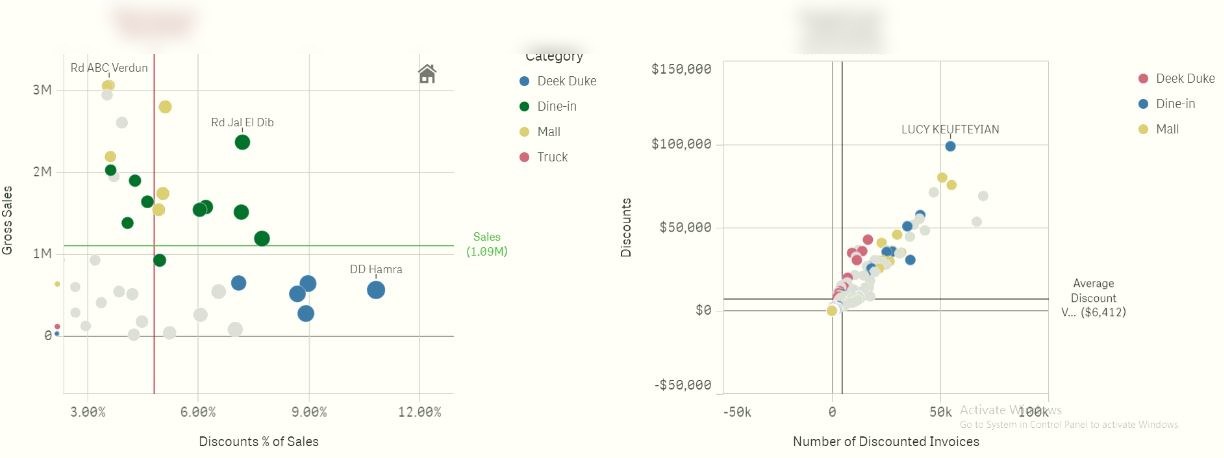 Discount 2×2
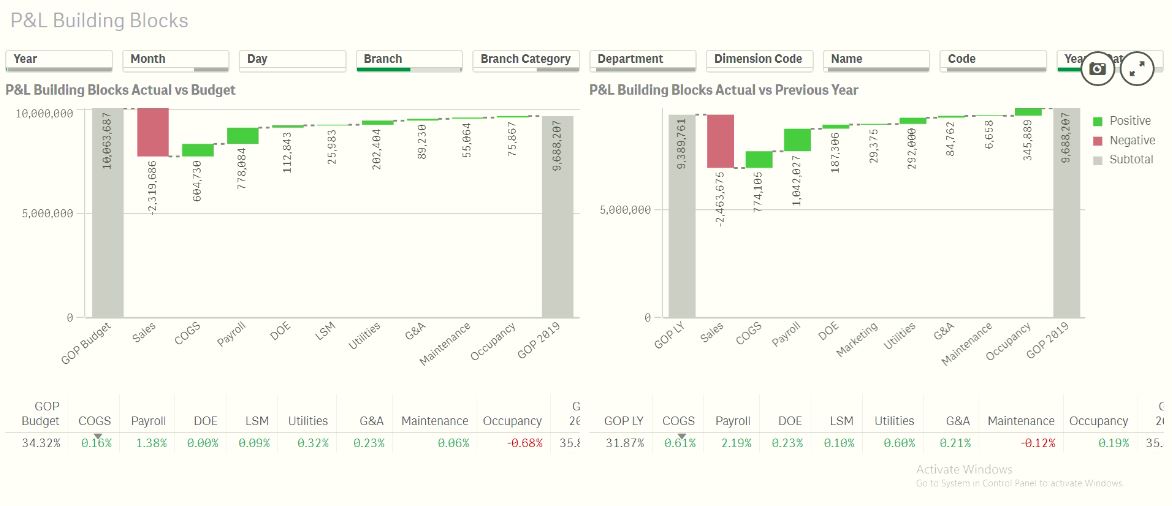 Cost Waterfall
03 / The Results
What used to take days of manual reporting is now answered in seconds. Leadership interrogates the business live, every branch and manager is accountable to the same numbers, and every decision, from pricing to staffing to menu mix, is grounded in evidence rather than opinion.
The Headline
Decisions that used to take days of gut feel now take minutes of evidence.
Any business question answered live, so leadership acts while the opportunity is still open.
Pricing, staffing, and menu decisions grounded in the same numbers across every branch and channel.
Every branch, channel, and cost line consolidated into one real time view leadership can trust.
Case Study
How a major hospital moved its primary clinics location and patient flow processes smoothly using a digital twin to anticipate bottlenecks before they occur.
01 / The Challenge
A leading hospital has a large primary care department with 15+ doctors working in 10 clinics, 5 nurses, and several clerical staff members at reception and check-out. The hospital decided to move the primary care clinics to a new and bigger location.
While the change of location was not expected to lead to a spike in demand on the short run, the processes had to adapt to the new layout. A few months before construction was complete, and ahead of the anticipated move, hospital management was concerned that the change in work environment would create hiccups in the process, leading to staff inefficiencies and amplified patient waiting times.
02 / The Approach
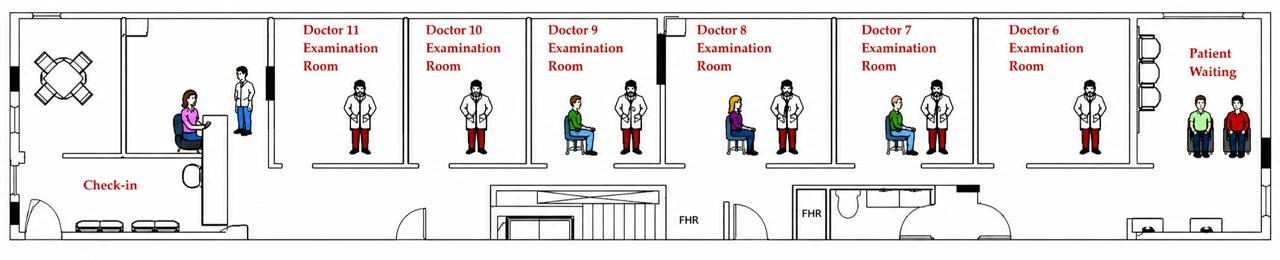
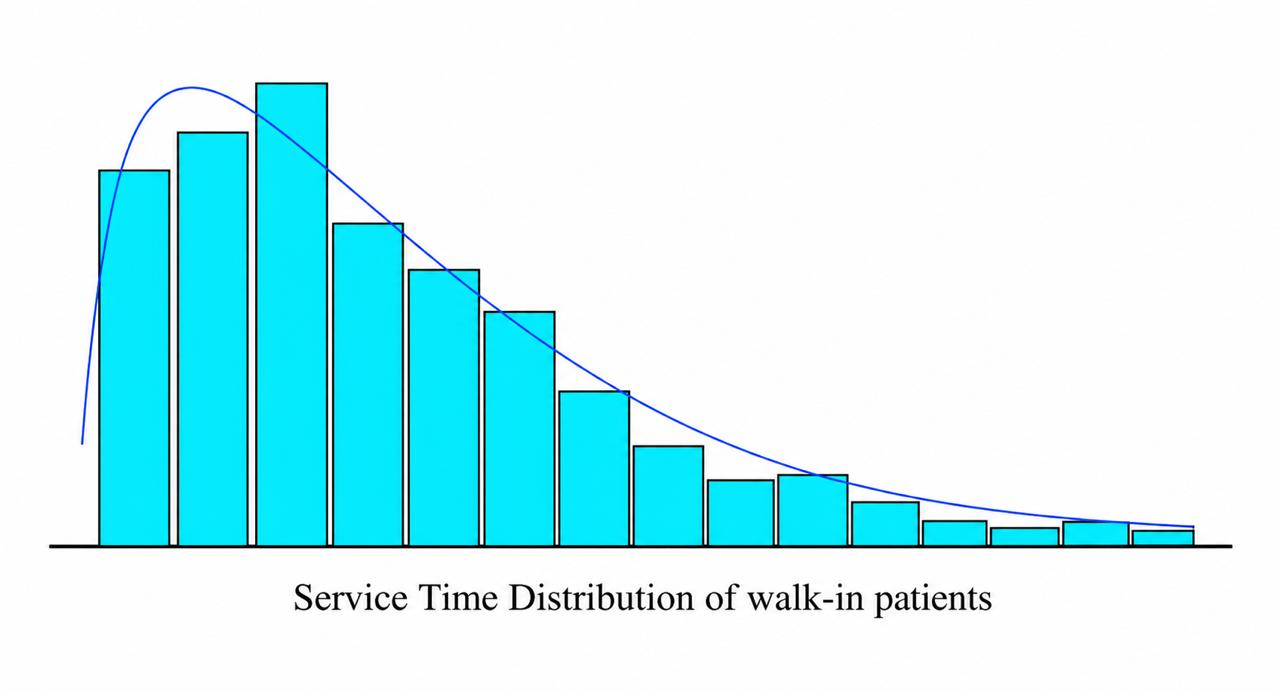
orcaid developed a process flow diagram for the way different patients would be served at the new location, which gave the staff clarity on their new work environment. Data was then collected on each process, including patient arrival, nurse assessment, and physician examination times, and probability distributions were fitted to capture normal variations in these processes. Finally, a digital twin was developed using simulation software, with an animation of a typical day of operations on the actual floor plan of the new location.
03 / The Results
Rather than waiting for the clinic move to observe operations and rectify any issues, orcaid’s digital twin helped the hospital anticipate problems before they occurred. Minor changes to the plan went far at a small cost. For example, adding one staff member at the right location reduced the average patient waiting time by 40%. A simulation-optimization was also done to determine the optimal time slots for doctor appointments, leading to further improvement in customer service and clinic revenue.
The Headline
Process flow modeling and digital twins significantly improve the patient experience and maintain the healthcare provider’s financial viability.
Process flow mapping reduces human error and helps standardize the patient experience.
Past data and process simulation handle uncertainty in supply and demand early on, with hard-data evidence.
Probabilistic modeling with digital twins delivers a better patient experience and more revenue for the provider.
Case Study
How a major manufacturer selected the most efficient strategy for their e-commerce operations.
01 / The Challenge
During the COVID pandemic, and other concurrent disruptions, one major manufacturer experienced significant growth in e-commerce sales originating from the company website. The challenge was in the order fulfilment strategy.
The company strategy had been to do storage, order picking, and packaging on-site, while outsourcing the order delivery to a specialized freight company. Two other strategies were on the table: full outsourcing, where the complete order fulfilment process would be subcontracted to a 3PL provider; or full vertical integration, where the company would acquire its own fleet of delivery vehicles, hire drivers, and handle the whole process in-house.
02 / The Approach
orcaid developed process flow diagrams for the current order fulfilment strategy and for the two proposed alternatives. This was followed by a detailed estimate of the cash flows, both Opex and Capex, involved in running the business under each strategy. Using base value estimates, a DCF analysis was carried out advocating the 3PL outsourcing option.
Given demand growth and uncertainty around some base estimates such as shipping rates, a detailed sensitivity analysis was carried out to investigate how the optimal strategy would shift with market conditions. The sensitivity analysis also helped identify which market parameters had a high impact on the decision. Probability distributions were then fit to estimates of these critical parameters, and a Monte Carlo simulation layered on top of the DCF analysis provided strong confidence in the proposed solution.
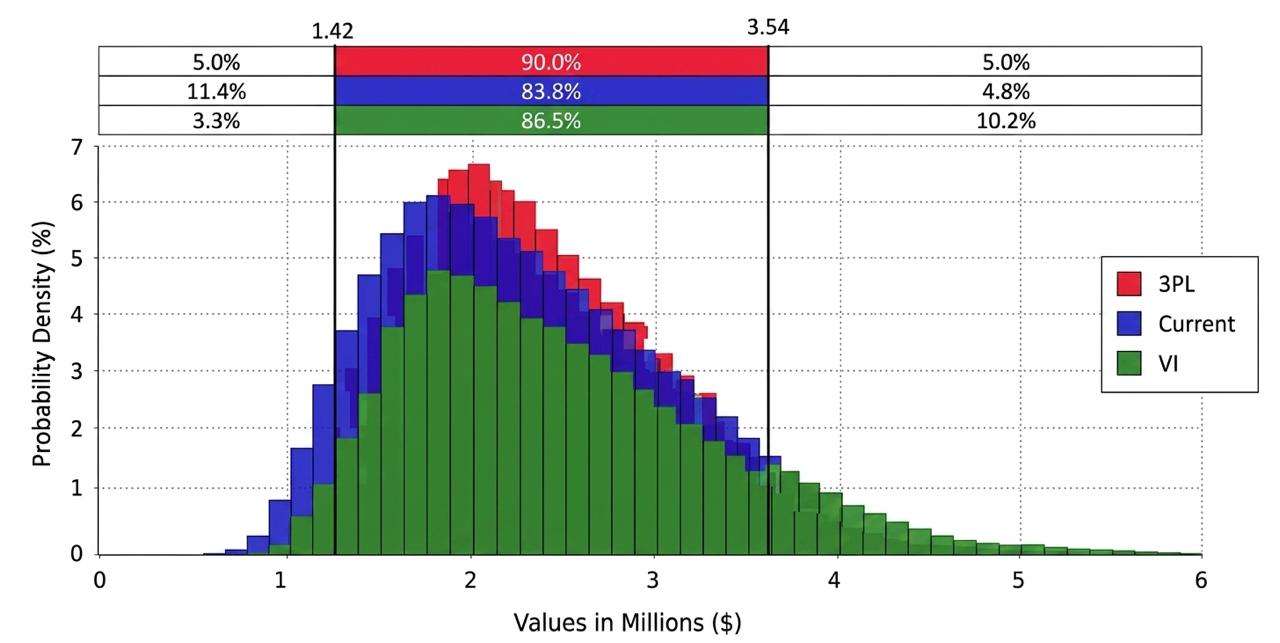 Sample output. Client data protected.
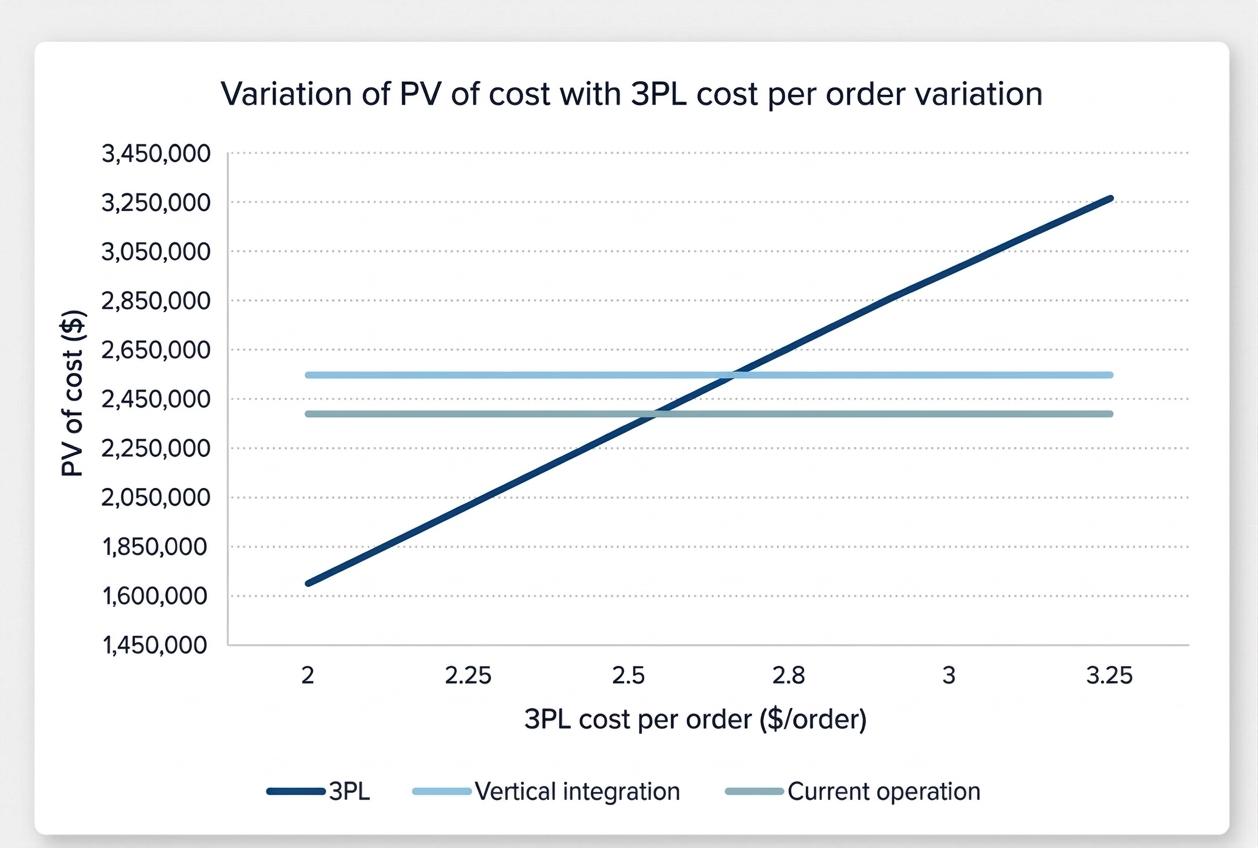 Sample output. Client data protected.
03 / The Results
By utilizing process mapping coupled with probabilistic cash flow analysis, orcaid advised the manufacturer on the operational strategy to follow. The sensitivity analysis showed the 3PL recommendation was robust to changes in environmental conditions such as shipping rates and demand patterns.
The Headline
Strategy grounded in number crunching, not slogans.
Operational flow details feed directly into the DCF analysis, producing a recommendation grounded in both worlds.
Operational decisions don’t just power daily execution, they shape long-term strategic direction.
The 3PL recommendation accounted for uncertainty thanks to the Monte Carlo analysis layer.
Case Study
How a major chain of supermarkets understood their customer segments, and what those segments want in terms of products and services.
01 / The Challenge
A major chain of supermarkets had 100+ branches and was interested in understanding how customers were segmented at different stores. Using loyalty cards and surveys, a market segmentation study was done at the flagship store, identifying five customer segments and their shopping habits in terms of how much they spent in each department.
Anticipating how customers were segmented at other stores would be highly beneficial for planning the product offering, store layout, and pricing. However, replicating the flagship study at each branch was costly and impractical. The challenge: come up with a customer segmentation for all stores based on a single study at the flagship.
02 / The Approach
orcaid made the reasonable assumptions that the same customer segments existed in all stores and that their purchase rates from each department stayed the same. A quadratic program was then developed to minimize the deviation between department sales predicted by the linear purchase rates and the actual sales, with decision variables capturing the split into the different segments.
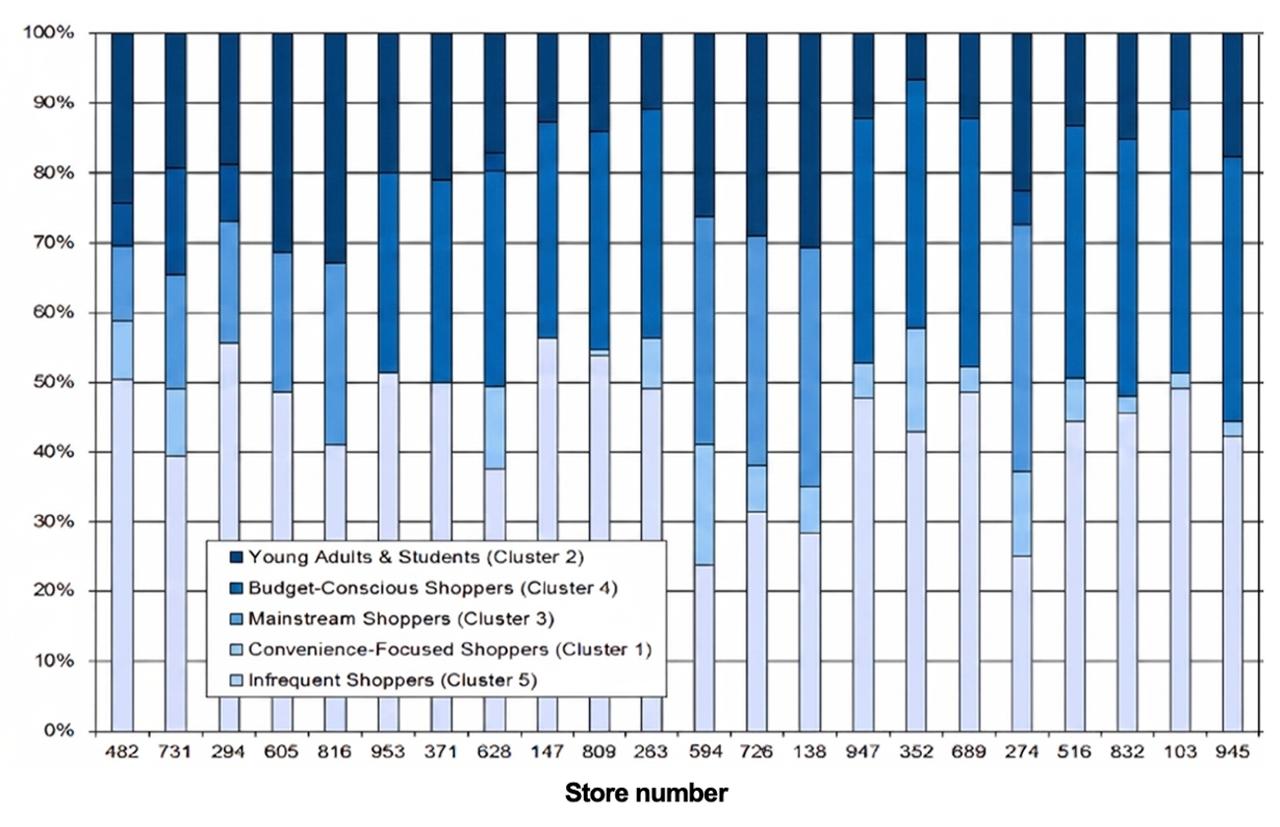 Sample output. Client data protected.
03 / The Results
By utilizing optimization techniques, orcaid developed market segmentation for all 100 stores with a minimal data collection cost limited to a single pilot study. This allowed the supermarket chain to better plan their assortment and store layouts. Results showed that entire departments could be eliminated from some stores to give more space to other departments that those stores’ customers actually preferred.
The Headline
While one store offering does not fit all, one study can fit all.
A compact model anchored on solid benchmark data does the job, no expensive multi-store study required.
A simple quadratic program, solvable in Excel, segmented customers across 100+ stores under the right model.
Customize product assortment across stores, even when the locations are close and demographics look similar.
Case Study
How a major downstream O&G distributor reduced fleet size and delivery inefficiencies using algorithmic route optimization.
01 / The Challenge
In downstream fuel distribution, routing is one of the largest cost drivers. Distribution alone can represent up to 75% of total logistics costs, and inefficient routing can increase operational costs by up to 30%.
Fuel delivery is a complex coordination problem. Each day, hundreds of stations must be serviced with different demand levels, across constrained truck capacities, compartment allocations, and geographic spread. Planning routes manually or using static rules leads to underutilized trucks and unnecessary travel distance, which in turn drives operational costs higher.
02 / The Approach
orcaid developed a vehicle routing optimization algorithm tailored for downstream fuel distribution. The model takes into account real operational constraints, including time windows, multi-scenario demand variations, truck capacities and compartment splits, and total travel distance and time. At both the truck and fleet levels, it provides full operational visibility, outputting detailed summary metrics such as travel times and distances, empty kilometers, truck utilization, costs, revenues, and profits.
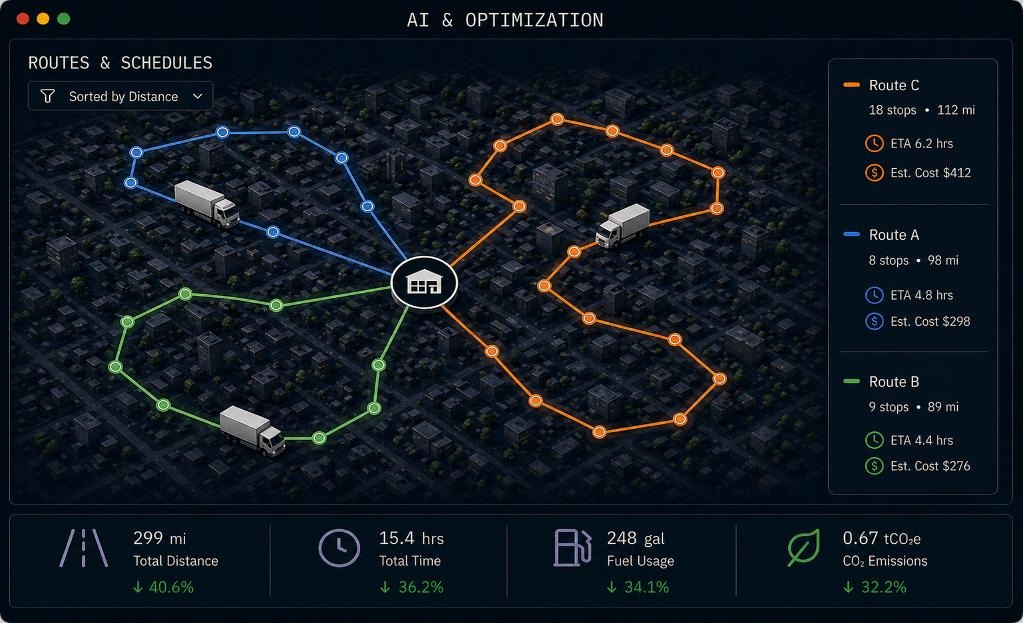 Sample output. Client data protected.
03 / The Results
The algorithm delivered significant gains across multiple demand variation scenarios, resulting in a substantial reduction in fleet size and operating costs. Service levels were fully maintained through optimized routes, travel distances, and per-truck utilization.
The Headline
37% fewer trucks needed. Lower total distances across the fleet.
Fewer trucks needed while maintaining full service coverage across demand scenarios.
Each truck serves more stations on average, with better load balancing, reducing idle time and maximizing capacity usage.
Routes are calculated to minimize total travel and fuel costs, cutting operational waste at scale.
Case Study
How a major hotel chain replaced the daily rate grind with an AI engine that prices every stay date for maximum revenue, automatically.
01 / The Challenge
Hotels face a relentless pricing challenge. Every stay date, across every room type, has to be priced correctly based on upcoming events, local demand pressure, competitor supply, seasonality, and the property’s own booking history. An underpriced peak night leaves money on the table. An overpriced soft night leaves the room empty.
Revenue managers spent hours each day reviewing rates, monitoring competitor sites, and adjusting prices across channels. The work was repetitive and increasingly impossible to do well at the pace the market moves. Static rules could not keep up, and gut feel decisions cost real revenue month after month.
02 / The Approach
orcaid built an AI driven dynamic pricing engine that analyzes every signal that matters: local and regional events, live demand pressure, competitor supply, booking pace, seasonality, and the property’s own historical performance. For every room type and every stay date, the engine recommends an optimal price calibrated to maximize total revenue while protecting occupancy targets. The model learns continuously, adapts to market shifts as they happen, and frees revenue managers to focus on strategy instead of spreadsheets.
03 / The Results
The AI pricing engine delivered measurable revenue uplift within the first 90 days. Occupancy improved, Average Daily Rate (ADR) climbed, and Revenue Per Available Room (RevPAR) moved significantly. The revenue management team stopped spending hours every day on manual rate updates and started focusing on strategy, segmentation, and commercial growth.
The Headline
RevPAR up 18%. Revenue managers back 18 hours a week. Every stay date priced by AI.
Higher ADR and occupancy translate into double digit RevPAR growth across the portfolio.
Revenue managers move from daily rate spreadsheets to higher leverage work on strategy, segmentation, and channel partnerships.
AI analyzes events, demand, supply, and history to recommend an optimal price for every date, continuously.